Project Goal
This project analyzed and modeled habitat requirements within Yosemite National Park for a high elevation bird, the Gray-crowned Rosy-Finch from a variety of raster data. The species is the highest breeding bird in North America and researchers at the University of California, Santa Cruz are evaluating what may be some of the most important habitat values for the species. They have learned that the species has an affinity for snowfields (foraging habitat), cliffs (nesting habitat), and high elevation areas (low competition). Using Yosemite Nation Park as a test site, I was able to describe regions that included all the habitat requirements.
Project Resources
Data for this project was sourced from USGS’s Earth Explorer, TNM Downloader, and National Park Service. To complete this habitat assessment, I used raster mosaic, clip raster, intersect, raster calculator, extract by attributes, DEM slope, and raster/vector conversion tools.
A Digital Elevation Model (DEM) was sourced from the USGS TNM Downloader and resulted in 72, 10000×10000 meter raster files. I used the Mosaic to New Raster tool to create a compiled raster of the 72 individual layers and then used clip raster to the bounds of the park.
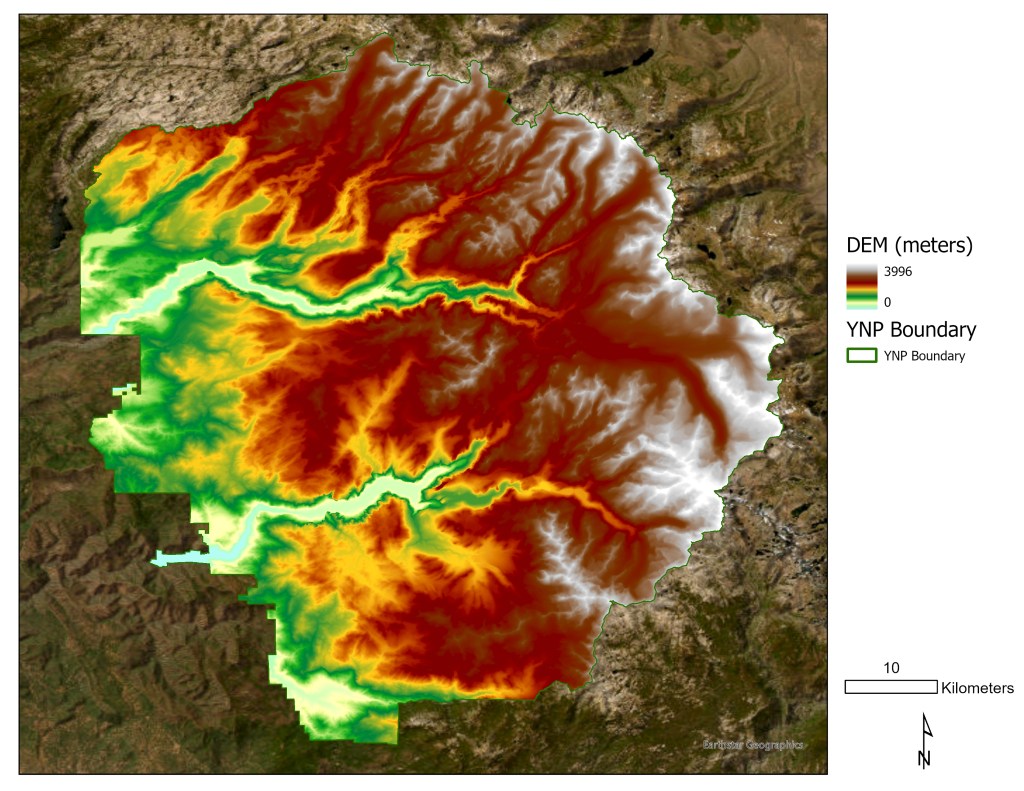
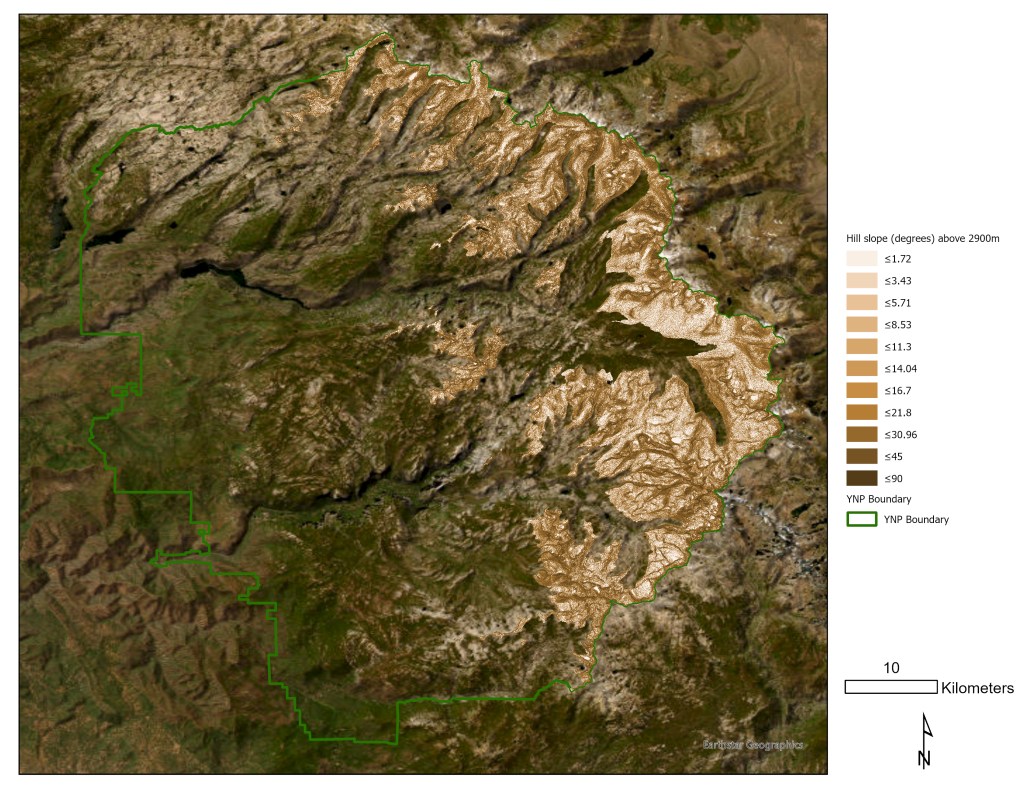
My next step was to define an elevation range for the species. As described in “Life History Account for Gray-crowned Rosy-finch”, the species typically summers at 2900 meters and above. I used the Extract by Attributes tool to create a new DEM with only those elevations. The highest point in Yosemite is 3996m and these elevations are found in the eastern region of the park.

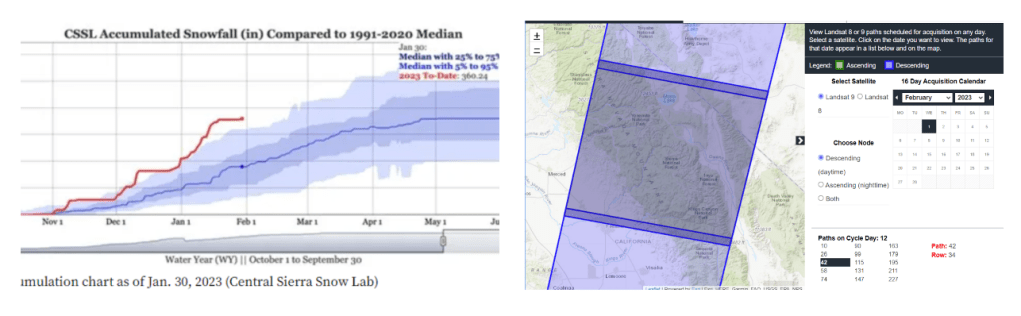
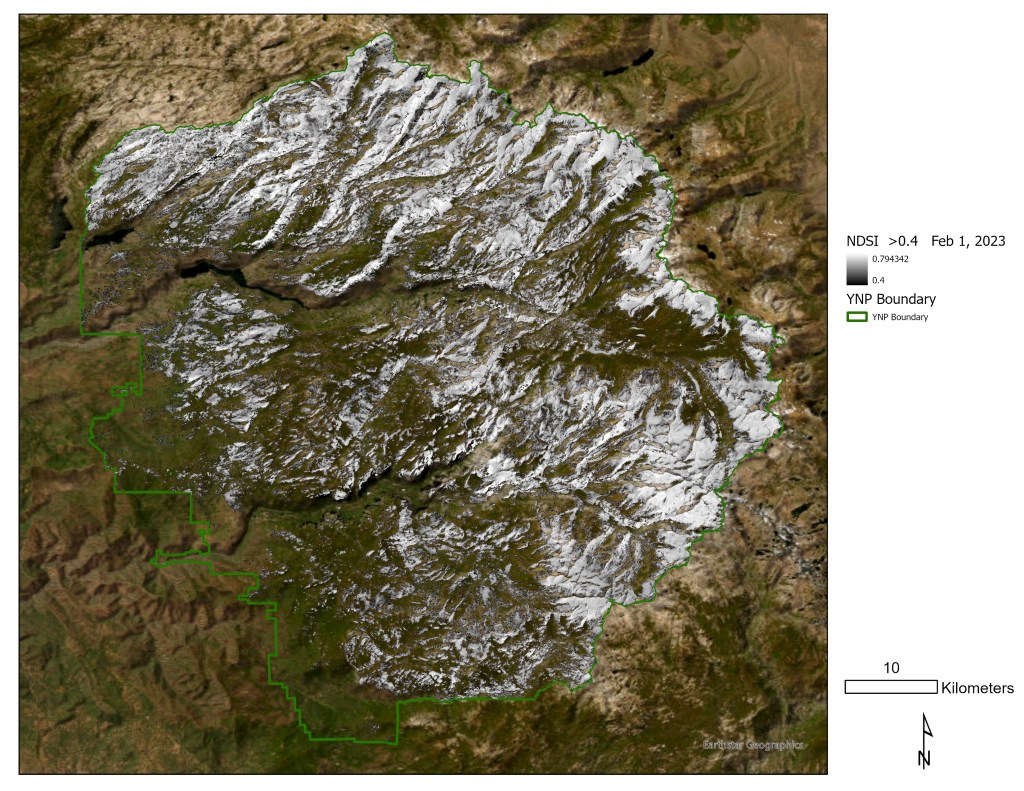
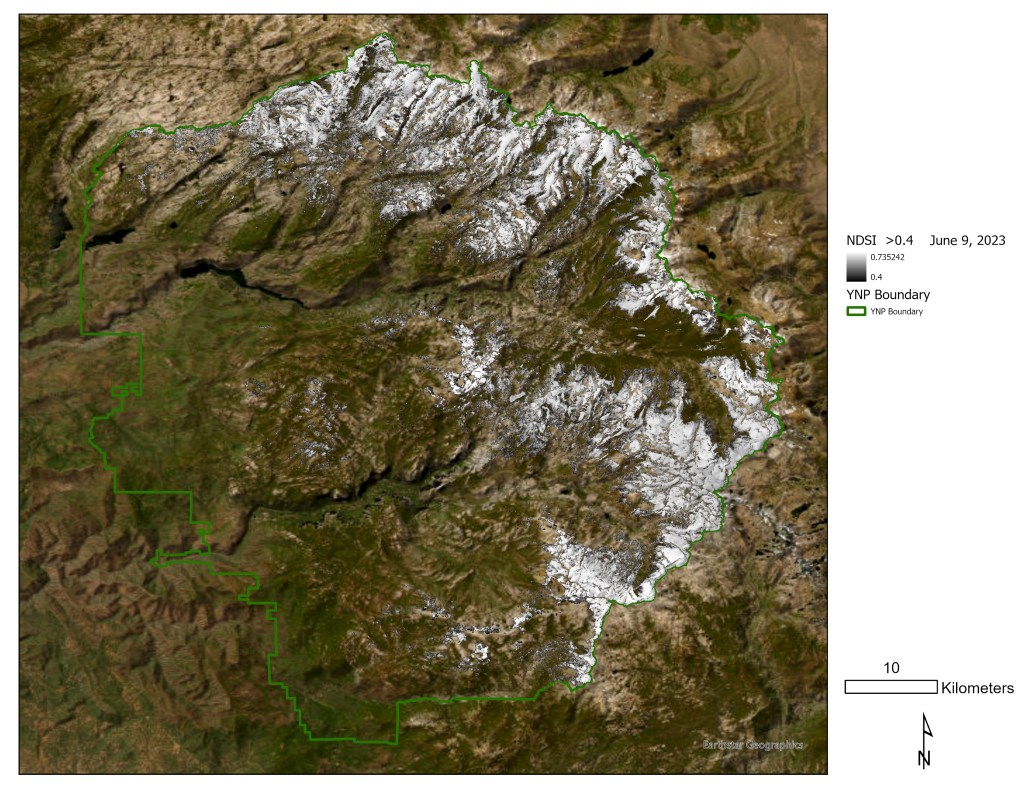
The next step in the puzzle was identifying areas with log-term snowpack. I downloaded LANDSAT 9 data from USGS across two dates, Feb. 1, 2023 (the day the Sierra Nevada accumulated an average year’s snowpack) and June 9, 2023 (a date when Rosy-finches are active in the alpine and using cliffs and snowfields).
The Normalized Difference Snow Index (NDSI) describes the relative magnitude of the reflectance between visible (green) and shortwave infrared (SWIR) within the site. In essence, this is an index that is related to the presence of snow within a pixel. NDSI = (Green-SWIR)/(Green+SWIR) or (Band 3-Band 6)/(Band 3+Band 6). This gave each pixel a value from -1 to 1. The closer the value is to 1, the higher the likelihood of snow.
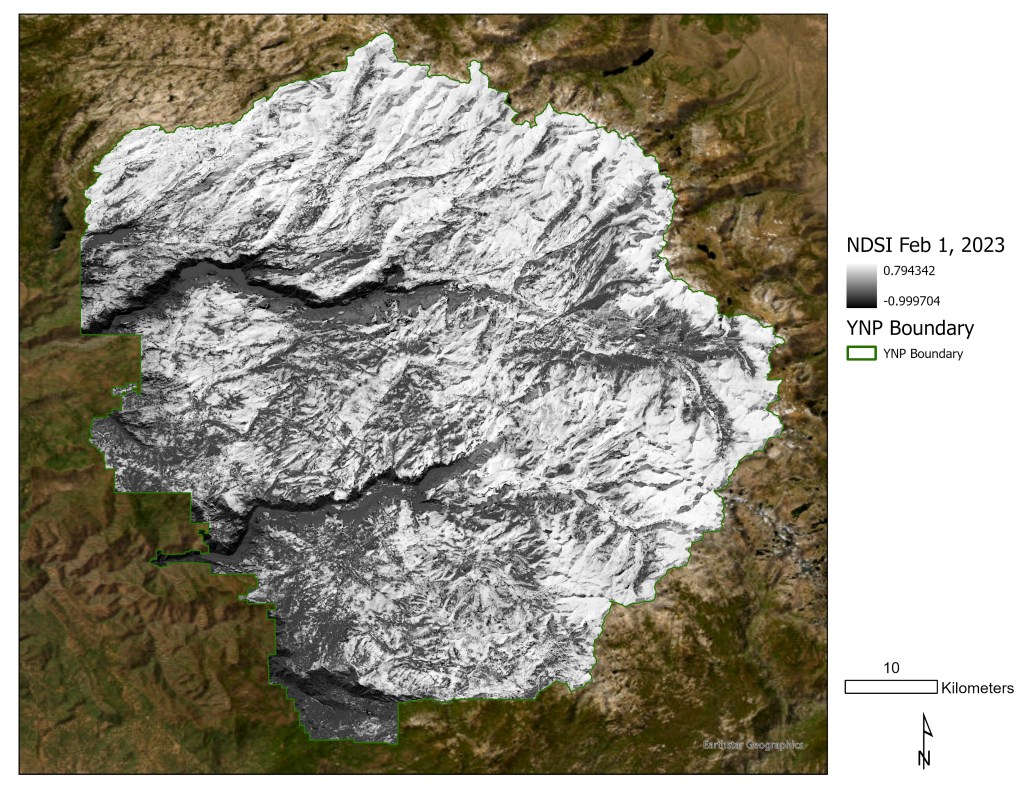

NDSI can typically detect snow when values are greater than or equal to 0.4 (http://profhorn.meteor.wisc.edu/wxwise/satmet/lesson3/ndsi.html). I ran another extract by attributes tool to extract only raster data with those values. Then, I created a copy of each raster and used the raster calculator to multiply all values by zero so that the Raster to Polygon tool could be used to extract the extent of the snowfields. Then using the Int function, I was able to use an integer raster to convert to a polygon.
The final piece of this puzzle was to define habitat by slope. Slope was calculated from a truncated DEM that only includes sites above 2900m. Using the Slope tool, cells were defined by their slope in degrees.
As the species has an affinity to cliffs, I decided to define suitable habitat as sites with 50 slope or greater. I then converted this raster to a vector and use the Pairwise Buffer tool to create a 100m buffer around each “cliff”.
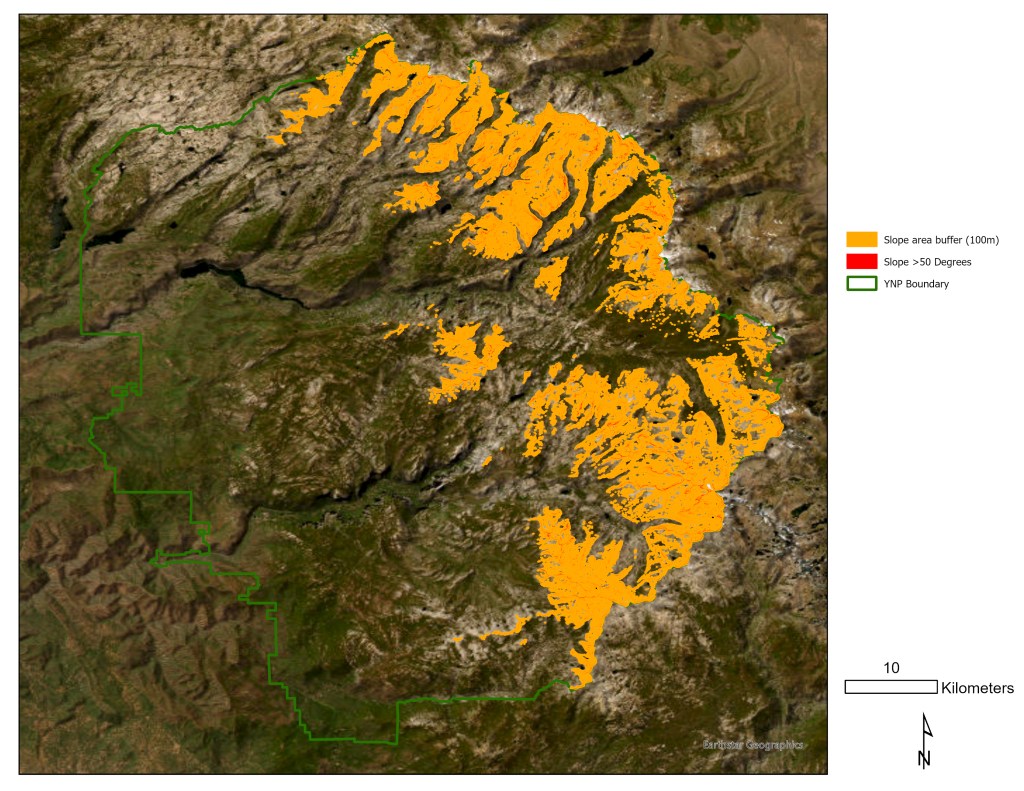
Using a Pairwise Intersect Tool, I was able to find the areas of overlap between the species’ requirement for slope, elevation, and snowpack.
Results
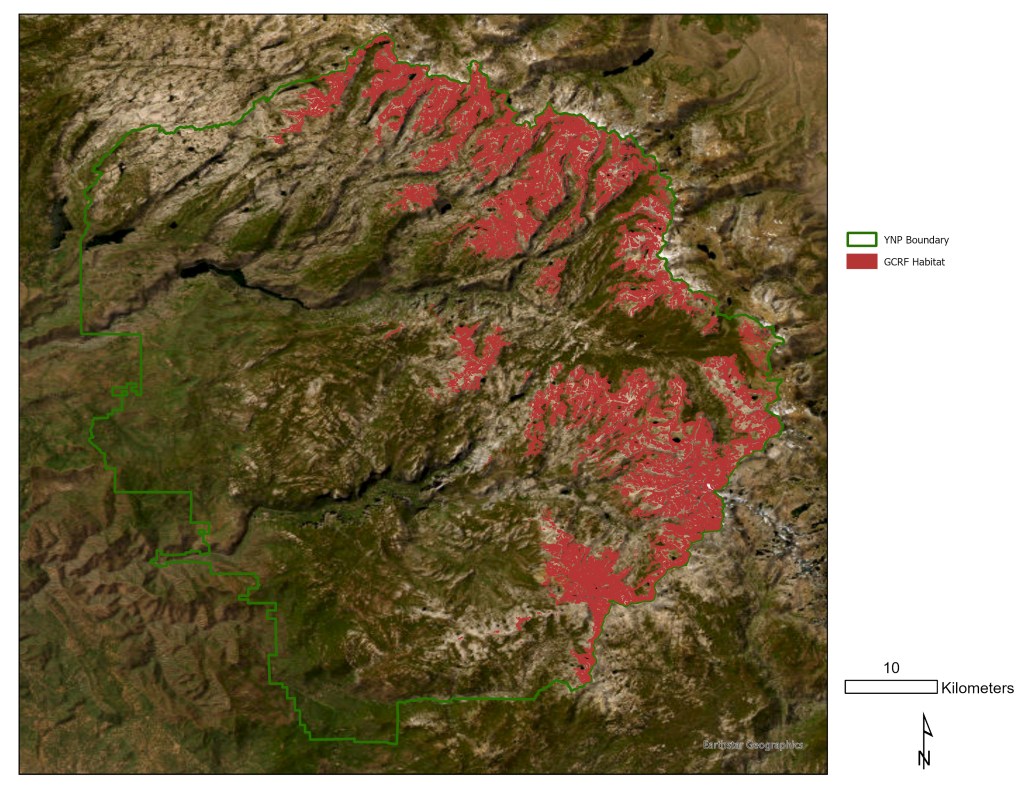
Results show that there is suitable habitat for the species within the eastern region of Yosemite National Park.
